
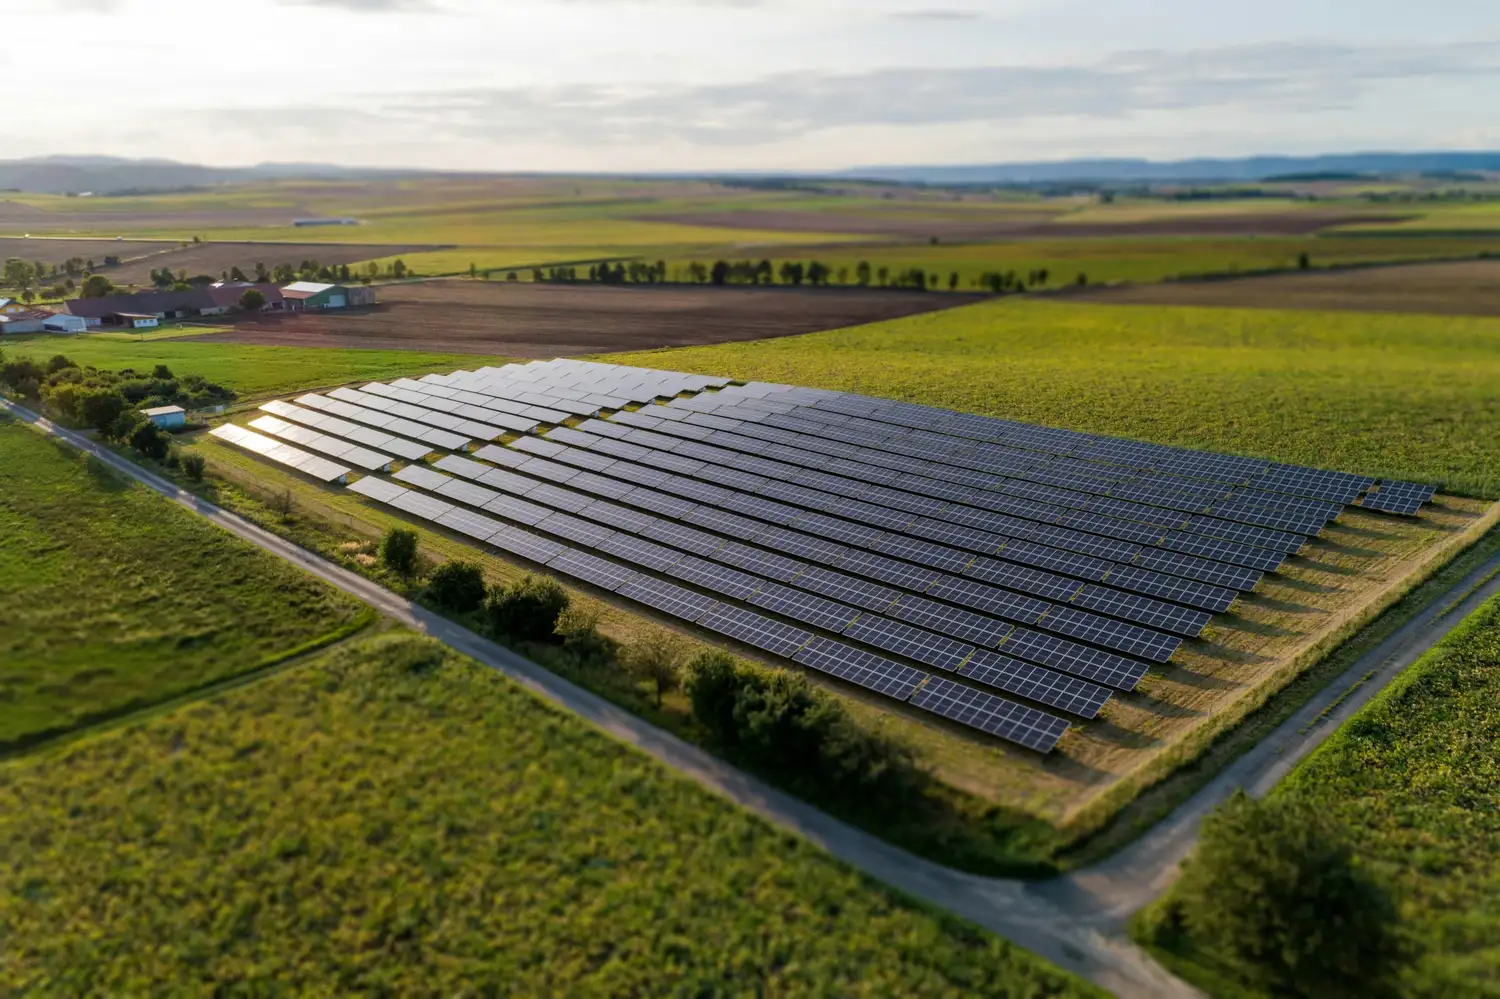
Solar farms are sold privately, so most prices never become public. The exceptions are deals involving listed funds, which have to announce them. Those are the ones below: real UK deals, with the price, the capacity and a link to the source.
The per-MW figures are our own arithmetic from the disclosed price and capacity. The parties did not quote them.
Operating solar farms
| Deal | Capacity | Price | Per MW |
|---|---|---|---|
| NextEnergy Solar Fund → Atrato Onsite Energy (Mar 2026) | 100MW | £46.2m | ~£462,000 |
| NESF Capital Recycling Programme, 5 assets in total | 245MW | ~£119m | ~£486,000 |
| Bluefield ← Trina, West Raynham, Norfolk (2020) | 49.9MW | £56.5m | ~£1,130,000 |
| Bluefield, 15 operational plants (2020) | 64.2MWp | £106.6m | ~£1,660,000 |
The two 2026 figures and the two 2020 figures are nearly three times apart. That is not the market crashing. It is two different kinds of asset.
- The 2026 sales were subsidy-free assets: the two 50MW sites at The Grange in Nottinghamshire and South Lowfield in Yorkshire, earning merchant power prices and whatever contracts sit over them.
- The 2020 sales were subsidy-era assets, built when Renewables Obligation and Feed-in Tariff support was still available. That support is attached to the asset, and buyers paid for it.
If someone quotes you a £/MW figure from a subsidy-era deal, it tells you almost nothing about a site being sold today. This is the most common mistake in the whole conversation.
Worth knowing: NextEnergy said the 100MW sale returned 1.1 times invested capital, and its recycling programme added about 2.44p per share to net asset value. So these were not distressed sales. The assets went at or slightly above book.
Projects under construction
| Deal | Capacity | Price | Per MW |
|---|---|---|---|
| Octopus Renewables Infrastructure Trust ← OnPath Energy, Barnsdale Solar Park, West Yorkshire (Oct 2026) | 55MW | £34.6m | ~£629,000 |
Two things to note before you use that number.
- The £34.6m includes the remaining construction costs, so it is not comparable with the price of a finished, working farm.
- The project holds a Contract for Difference running to 2041, a fixed, inflation-linked price for its power. That is worth a great deal and most sites do not have one.
Sources also disagree on the capacity: most report 55MW, one reports 40MW. We have used 55MW. If the lower figure is right, the per-MW price is higher.
Rooftop is a different market again
| Deal | Capacity | Price | Per MW |
|---|---|---|---|
| Atrato Onsite Energy portfolio → Phoenix UK Bidco (Brookfield joint venture), Nov 2024 | 204MW | £218.7m | ~£1,070,000 |
Rooftop and onsite solar sells for more per MW than ground-mount. The power is usually sold directly to the building’s occupier under a long contract, rather than exported at wholesale prices. Different revenue, different price. Do not benchmark a field against it.
Ready-to-build: nobody publishes the price
This is the honest answer, and it matters if you are the one holding a consented site.
We could not find a single UK ready-to-build solar sale with a disclosed price. RTB deals happen constantly, and they are announced, but the consideration is almost always withheld. Recent examples, all reported without a price:
- Forsa Energy’s purchase of the 59.3MWp Wormald Green project from Harmony Energy
- Gülermak Renewables’ purchase of the Steyning project from Cero Generation
- Downing’s purchase of the 42.5MW Higher Witheven project in Cornwall
The closest published benchmark is from the analyst firm Enerdatics, which puts the developer premium on European utility-scale solar outside Germany at $20,000 to $35,000 per MW at early stage, rising to as much as $160,000 per MW for ready-to-build projects with co-located battery storage. Note what that is: a premium paid for the development work, in Europe, in dollars. It is not a UK headline price, and it is not the price of a built solar farm.
That gap, between $160,000 per MW at RTB and roughly £462,000 per MW once built, is the cost of actually building it.
The strange thing about 2026
The listed solar funds are trading well below what their assets are worth on paper:
- NextEnergy Solar Fund: net asset value 73.2p per share at 30 June 2026, with the shares at a discount of around 37%. The board launched a formal sale process on 15 July 2026.
- Foresight Solar Fund: net asset value 94.9p per share at 30 June 2026, down from 99.2p at the end of December, at a discount of around 26%. The board is reviewing its options and running a targeted disposal programme.
And yet, when those same funds actually sell solar farms, they get book value or a little above it.
The public market is marking solar funds down by a quarter to a third. Private buyers are paying full price for the assets inside them. If you own a site, that second number is the one that matters to you.
Three ways people misuse these figures
- Mixing stages. An operating farm’s price includes the built plant: panels, inverters, transformers, cabling, the substation. A consented site is the right to build one. The gap between them is the construction cost, and it is most of the number.
- Mixing eras. Subsidy-era assets traded at two to three times today’s subsidy-free prices. Those comparables are dead.
- Mixing asset types. Rooftop, ground-mount, battery and co-located sites price differently, for good reasons.
How solar farms are valued sets out what drives the number at each stage. How solar farms are bought and sold covers the process.
What we do
We develop sites from a bare field to ready-to-build, and we build consented sites with partners. If you are trying to work out what your site or project is worth, tell us the stage, the capacity and the grid position and we will give you an honest view rather than a per-MW figure borrowed from someone else’s deal.
Talk to us about a site → · Consented but not built? →
Sources
- QuotedData: NextEnergy Solar sells two UK assets to Atrato for £46m
- reNews: NextEnergy sells 100MW UK solar portfolio
- Solar Power Portal: NextEnergy Solar Fund opens sale process
- Solar Power Portal: ORIT takes on OnPath-developed West Yorkshire solar farm
- Yorkshire Post: Barnsdale Solar Park set to be sold for £34.6m
- Morningstar: Atrato Onsite Energy confirms sale of portfolio for £219 million
- Solar Power Portal: Bluefield Solar seals £56.5 million Norfolk solar farm purchase
- QuotedData: Foresight Solar accelerates strategic review as NAV falls
- Enerdatics: why UK solar M&A is moving toward ready-to-build PV assets
Prices as reported at the time of each deal, last checked 2 November 2026. Per-MW figures are our own calculation from the disclosed price and capacity. Not investment advice, and not a valuation of any particular site.